Monitoring containers with cAdvisor
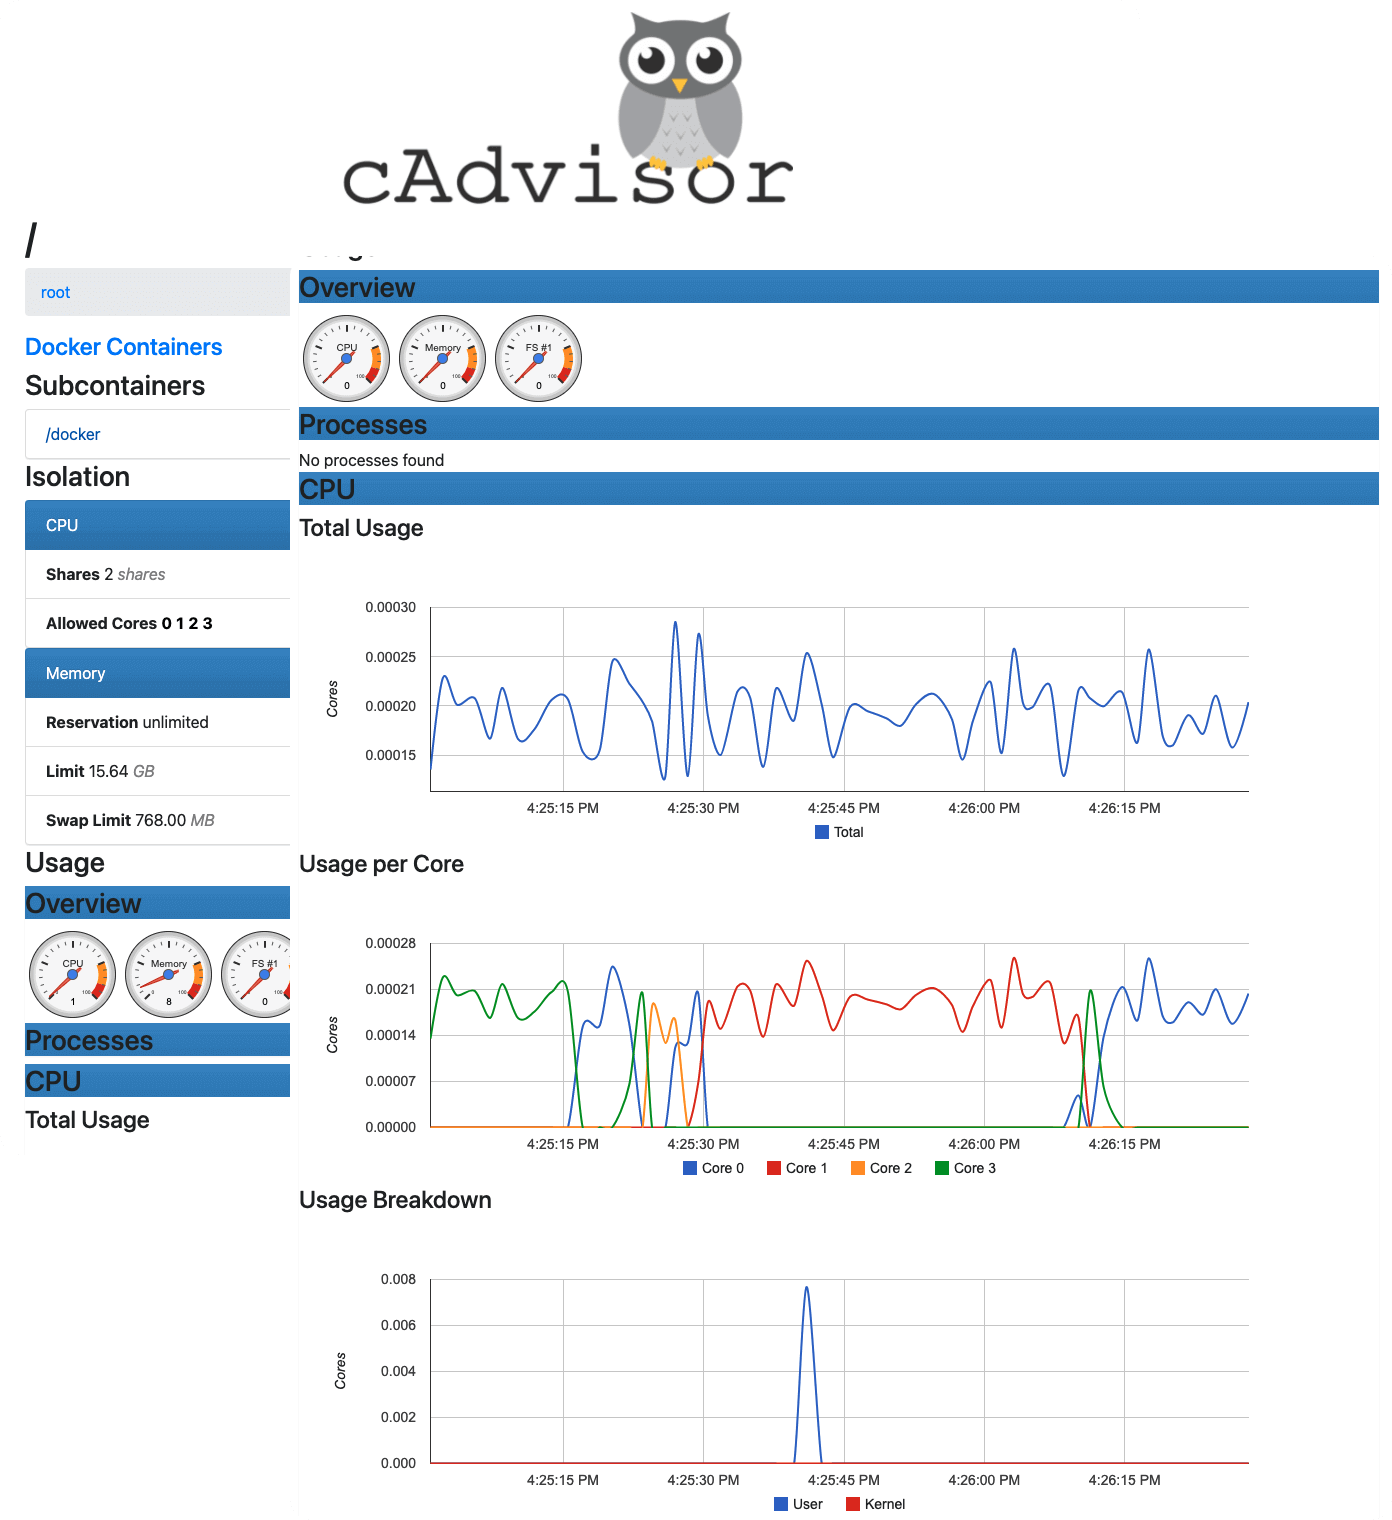
Monitoring with cAdvisor allows you to gather information about individual Docker containers. cAdvisor runs as a daemon and collects the information about running containers, crunches the data, and exports it to your backend system of choice (Prometheus, ElasticSearch, StatsD). This article shows you how to install cAdvisor and get the metrics to show up on a dashboard in Grafana.
- Prometheus
- StatsD
- ElasticSearch
- BigQuery
- InfluxDB
- Kafka
- or to standard out
sudo docker run \
  --volume=/:/rootfs:ro \
  --volume=/var/run:/var/run:ro \
  --volume=/sys:/sys:ro \
  --volume=/var/lib/docker/:/var/lib/docker:ro \
  --volume=/dev/disk/:/dev/disk:ro \
  --publish=8080:8080 \
  --detach=true \
  --name=cadvisor \
  --privileged \
  --device=/dev/kmsg \
  gcr.io/cadvisor/cadvisor:v0.37.5
Note
The latest version of cAdvisor at the time of writing this was v0.37.5. Make sure you're always using the latest bits.
Running cAdvisor in Kubernetes
/metrics/cadvisor endpoint.kubectl to retrieve the cluster node metrics and Pod metrics:$ kubectl get --raw /apis/metrics.k8s.io/v1beta1/nodes/[node-name]
{
"kind": "NodeMetrics",
"apiVersion": "metrics.k8s.io/v1beta1",
"metadata": {
"name": "[node-name]",
"selfLink": "/apis/metrics.k8s.io/v1beta1/nodes/[node-name]]",
"creationTimestamp": "2021-08-26T22:12:26Z"
},
"timestamp": "2021-08-26T22:11:53Z",
"window": "30s",
"usage": {
"cpu": "39840075n",
"memory": "487200Ki"
}
}
/apis/metrics.k8s.io/v1beta1/namespaces/<NAMESPACE>/pods/<POD_NAME> to get the metrics about a specific pod.httpbin deployment:kubectl apply -f https://raw.githubusercontent.com/istio/istio/master/samples/httpbin/httpbin.yaml
$ kubectl get --raw /apis/metrics.k8s.io/v1beta1/namespaces/default/pods/httpbin-74fb669cc6-xs74p
{
  "kind": "PodMetrics",
  "apiVersion": "metrics.k8s.io/v1beta1",
  "metadata": {
    "name": "httpbin-74fb669cc6-xs74p",
    "namespace": "default",
    "selfLink": "/apis/metrics.k8s.io/v1beta1/namespaces/default/pods/httpbin-74fb669cc6-xs74p",
    "creationTimestamp": "2021-08-26T22:15:40Z"
  },
  "timestamp": "2021-08-26T22:15:16Z",
  "window": "30s",
  "containers": [
    {
      "name": "httpbin",
      "usage": {
        "cpu": "316267n",
        "memory": "38496Ki"
      }
    }
  ]
}
Connecting cAdvisor to Prometheus and Grafana
/metrics endpoint.# HELP cadvisor_version_info A metric with a constant '1' value labeled by kernel version, OS version, docker version, cadvisor version & cadvisor revision.
# TYPE cadvisor_version_info gauge
cadvisor_version_info{cadvisorRevision="de117632",cadvisorVersion="v0.39.0",dockerVersion="20.10.3",kernelVersion="5.4.104+",osVersion="Alpine Linux v3.12"} 1
# HELP container_blkio_device_usage_total Blkio Device bytes usage
# TYPE container_blkio_device_usage_total counter
container_blkio_device_usage_total{container_env_ARG1="",container_env_ARG2="",container_env_CADVISOR_HEALTHCHECK_URL="",container_env_DEFAULT_HTTP_BACKEND_PORT="",container_env_DEFAULT_HTTP_BACKEND_PORT_80_TCP="",container_env_DEFAULT_HTTP_BACKEND_PORT_80_TCP_ADDR="",container_env_DEFAULT_HTTP_BACKEND_PORT_80_TCP_PORT="",container_env_DEFAULT_HTTP_BACKEND_PORT_80_TCP_PROTO="",
...
/metrics endpoint.Installing Prometheus on Kubernetes
kube-prometheus repository:git clone https://github.com/prometheus-operator/kube-prometheus.git
kube-prometheus folder and deploy the CRDs first:kubectl apply -f manifests/setup
kubectl apply -f manifests/
kubectl get pod -A to check all pods are up and running), you can open the Prometheus UI:kubectl port-forward svc/prometheus-k8s 9090 -n monitoring
http://localhost:9090, you can now query for any metrics collected by the cAdvisor - e.g., metrics starting with container_* as shown in the figure below.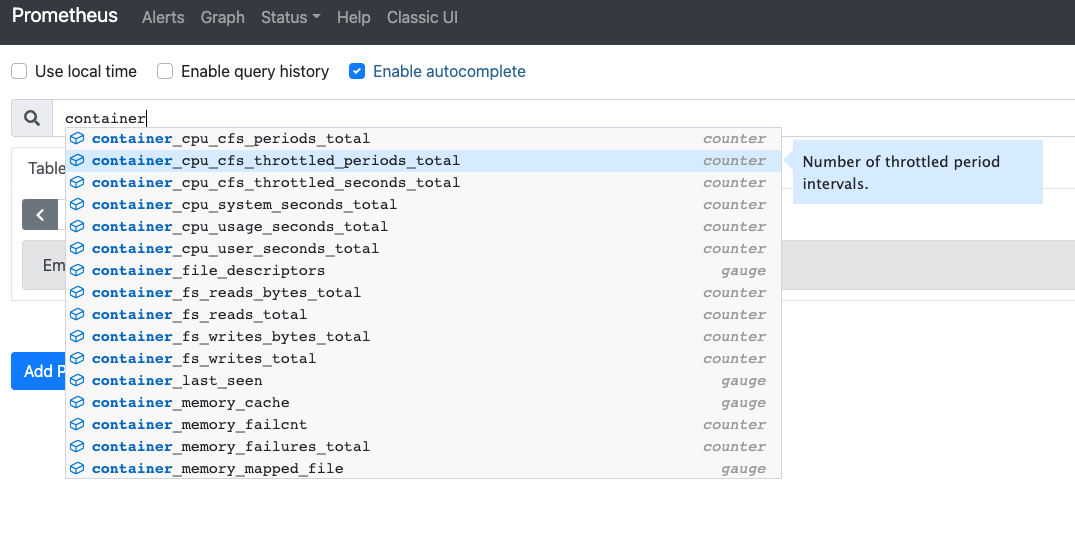
Grafana dashboards
kube-prometheus operator. We can open the Grafana UI by port-forwarding to port 3000:kubectl port-forward svc/grafana 5000:3000 -n monitoring
http://localhost:5000 you'll notice there's already a set of pre-created dashboards that came with the kube-prometheus operator.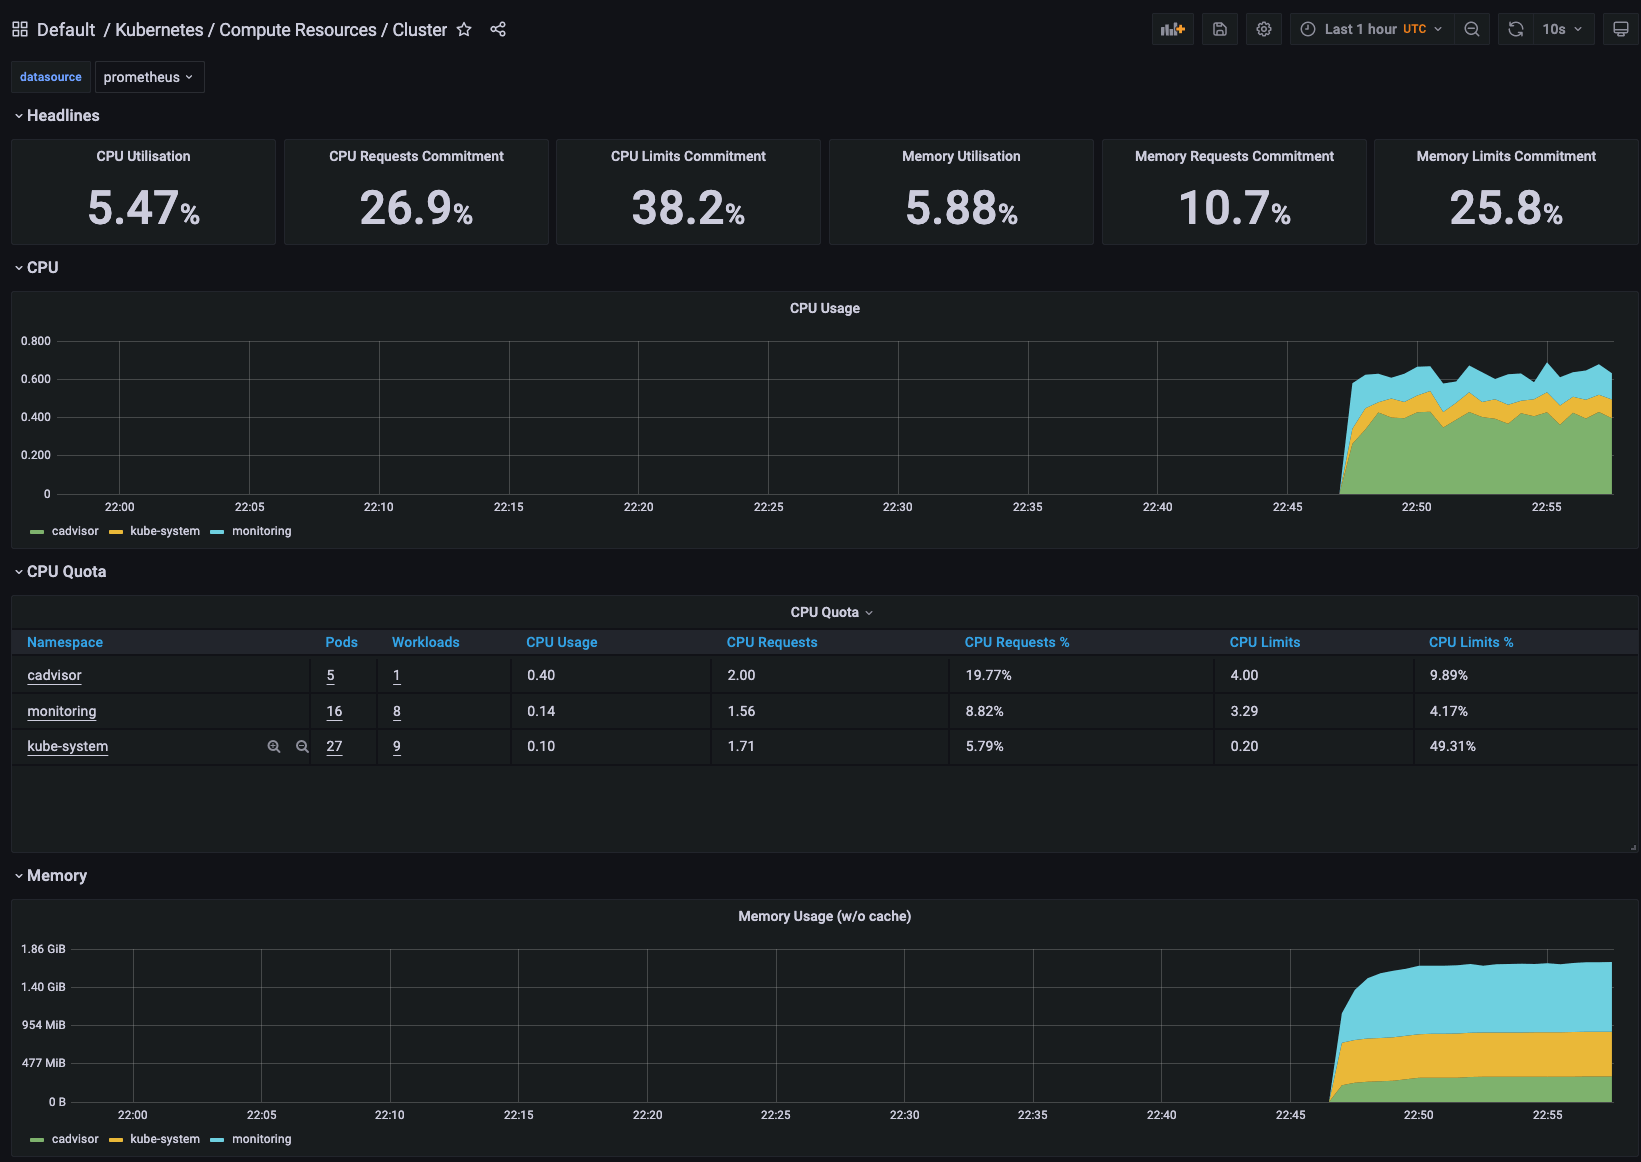
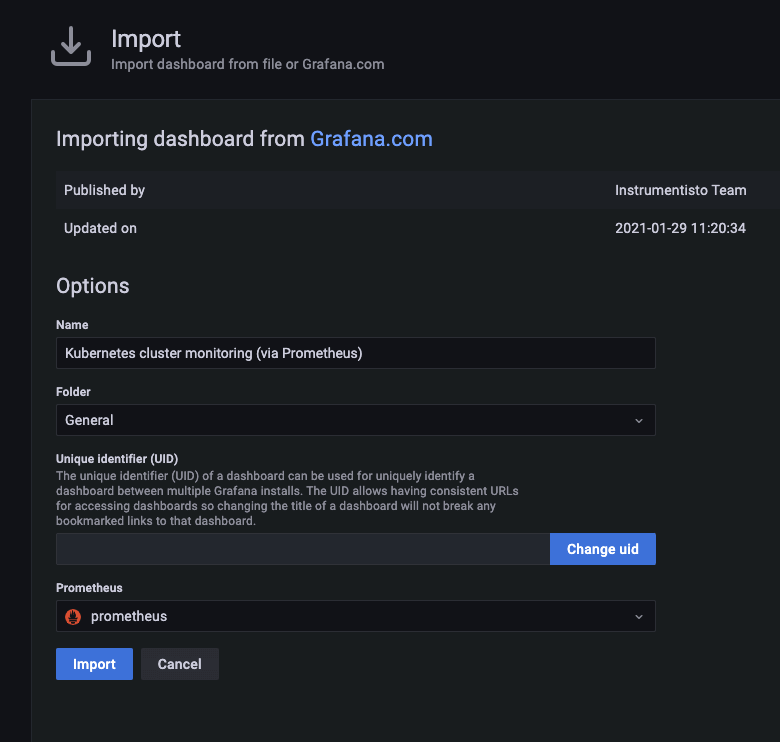
- In Grafana, go to the "+" button on the sidebar.
- Click Import.
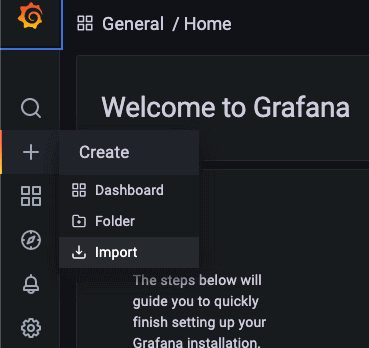
- Paste the dashboard ID (315 in our case) to the ID text field
- Click the Load button.
- From the Prometheus drop-down list, select "prometheus".
- Click the Import button.
