
In this article I'll explain how you can use Istio in combination with ngrok to debug a service running locally on your machine while the production version of the service is running in the cluster and is not being modified in any way.
You might have heard about a similar approach using mirroring, however that one can be awkward, especially because you need a public IP address in order to be able to use the service entry to point to it. The approach I am going to explain uses ngrok and a combination traffic rules to redirect traffic meant for debugging to the version of the service running locally on your machine. See the figure below for more details.
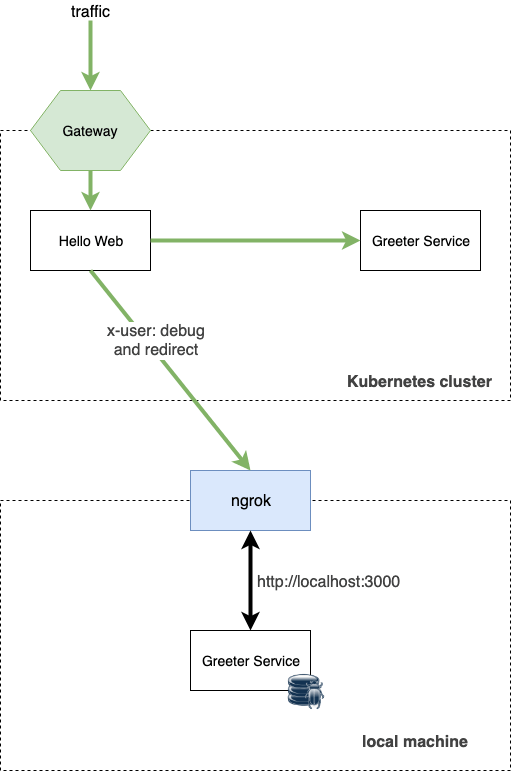
In this approach I will use a specific header (x-user) and use the redirect functionality in the virtual service to direct traffic to the debug version of the service. The service running locally will be exposed through the public URL using ngrok.
Start the local greeter service and run it under the debugger, then launch ngrok with the following command (assuming your service runs on port 3000 locally):
ngrok http 3000
Running this command exposes your http://localhost:3000 on a publicly available address. When I ran the command, the external URL I got was http://97260680.ngrok.io. Try opening the Ngrok URL in the browser to make sure the breakpoint gets hit and forwarding works.
Next, let's create the virtual service, the match condition and the redirect:
cat <<EOF | kubectl apply -f -
apiVersion: networking.istio.io/v1alpha3
kind: VirtualService
metadata:
  name: greeter-service
spec:
  hosts:
  - greeter-service
  http:
  - match:
    - headers:
        x-user:
          exact: debug
    redirect:
      authority: 97260680.ngrok.io
  - route:
    - destination:
        host: greeter-service
        port:
          number: 3000
EOF
The above virtual service tries to match the x-user header to debug value and if there's a match, it redirects to the URL specified in the authority field. This is the URL where the service running locally is exposed on. If you deploy this, you can send the following request using curl to see the breakpoint hit in your service:
$ curl -v -H "x-user: debug" http://localhost
Similarly, visiting the URL in from a browser and setting a header will trigger a breakpoint as well. If you remove the x-user header or set it to a different value, the breakpoint won't get hit and the service running inside the cluster will get invoked instead.